Drawing from extensive experience working with lots of fast-growing companies, I knew there was more to better decisions than just more tools, more dashboards, and more visualizations. In addition, getting to insights faster doesn’t always ensure you’ll get to the correct business aspirations. The essence of strategy is to find a unique position in your business that delivers unique value to the customers you choose to serve. In many companies, there is a fundamental inability to make the right decisions that ultimately lead to success. So, I wanted to go under the permafrost and uncover the fundamental relationship between a company’s growth with respect to its data strategy, and the effect of data maturity on growth.
The Current State of your Data Strategy
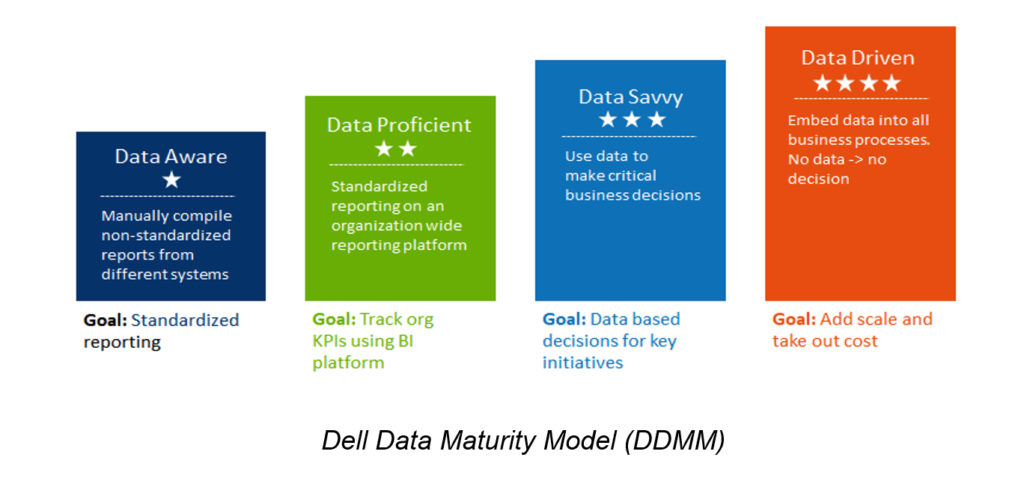
Your current data strategy and maturity could be hindering growth. To illustrate and understand how this is possible, we first need a yardstick for which to measure “Data Maturity.” For our purposes, we’ll use a commonly accepted model to measure maturity, the Dell Data Maturity Model (DDMM), and then plot it over a period of time.
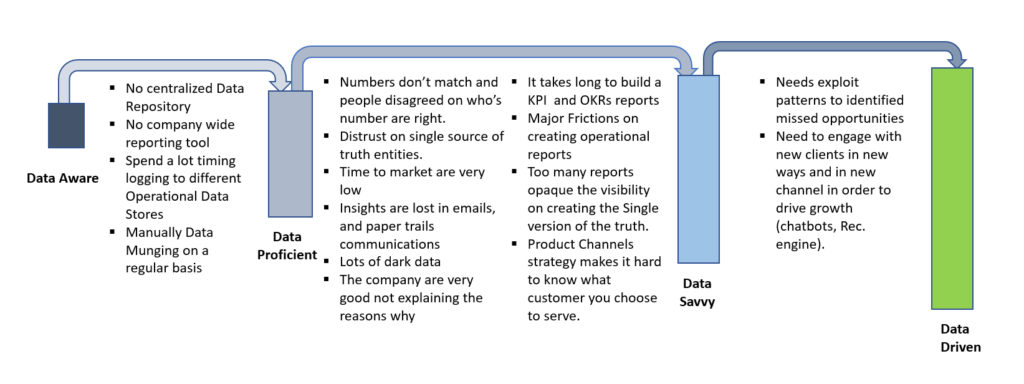
The graphic below illustrates the pains that a company feels just before it transitions from one stage of the DDMM to the next.
The gap between Data Proficient and Data Savvy is wider when comparing to the other phases. Most companies never achieve this goal. In fact, a lot of businesses mistakenly begin investing in becoming Data Driven by hiring lots of Data Scientists, for example, before achieving the Data Savvy stage. In other words, they confused the goal or aspirations with the strategy and, as a result, their newly hired Data Scientists get frustrated spending eighty percent of their time doing data gathering, data munging and data sanitizing, incurring technical debt because the company never did the “ground work” or laid the foundation. In Dell’s model, along with other models, data maturity grows in phases. However, the one dimension missing from this diagram is cadence. That is, how long does a company typically spend (period of time) in each stage? We will come back to this question.
Let’s take a closer look at the growth stages of companies and the impact of data maturity.
Stage 1: The Startup Phase
The company has a small number of employees focused on data and growing databases. At this phase you’re building a plane and trying to fly in it simultaneously. Growth will be in small steps and data-driven decision-making usually takes the form of ad-hoc Excel spreadsheets. A solid data strategy is not just one quick step, it’s a set of steps which involves all the business functions and it will usually take 2 to 3 years to mature.
Stage 2: The Ramp-Up Mindset Phase
This phase is all about trying to scale-out your production and sales energies, and get your product out to the market. Product velocity is happening quicker than you realize, and you have little concern for process inadequacies. Your growth engine is so commanding that you’re just blazing past any market entrants. Eventually, all that hyper growth creates some abrasion that catches up with you. In many companies, there is a fundamental inability to understand the decision landscape and make choices, which ultimately has an impact on your success.
Stage 3: The Enterprise Phase
The golden years of exponential growth have ended. It’s inevitable, but all high performing companies ultimately settle down into sustainable growth. Your unique value proposition makes you a key differentiator for the customers you have chosen to serve. Growth over time becomes linear, and decision-making inadequacies play a bigger role in slowing down growth.
Why Data Maturity Lags Company Growth over Time
How long does a company spend in each of the Data Maturity stages, and when does a transition occur comparative to growth? Usually, stepwise improvements are typically tied to business decisions like hiring a BI consultant, eventually a reporting/BI team, or building a data lake, data warehouse or a data lake house. The acquiring of analytics resources and technologies is typically a part of all these transitions, and it creates competitive advantage by giving companies new ways to outperform their rivals.
To track and understand Data Maturity against Growth over time, we combine a few things:
Company Growth in terms of Revenue over time
The Dell Data Maturity Model with cadence
Typical pains experienced by companies at each stage of their Data Maturity
From what we have seen consistently across companies of all sizes, these things don’t just gracefully line up when you join them, and that’s the reason we find a thought-provoking pattern in most companies.
If you add cadence (period of time) to the Dell Data Maturity Model, you can illustrate how long most successful companies stay in each stage of the DDMM. Then if you overlay company revenue growth, you consistently see this pattern occurring:
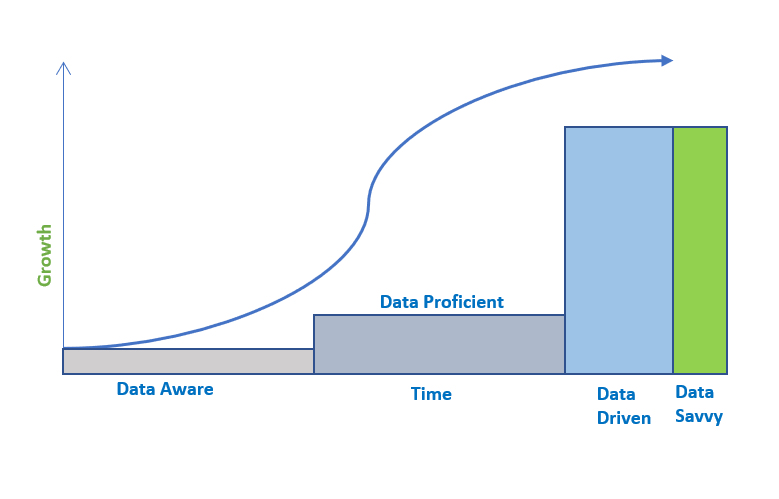
How long do companies typically spend in each stage of the DDMM? As you can observe, data maturity grows in phases, typically the result of transitions caused by precipitating events. The data maturity curve isn’t so much a curve as it is a series of stages. If we were to fit our curve to those steps and overlay that, we’d see the following:
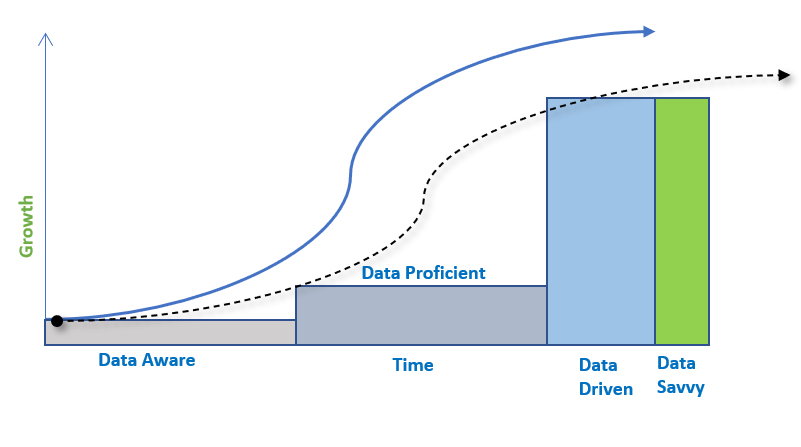
Notwithstanding that cross correlation does not imply causation, what I anticipated to observe was that as companies implement data assets and strategies, the data maturity curve would lead its growth curve. And while higher data maturity doesn’t necessarily cause higher growth, a leading data maturity curve would at least have been in-line with my outlook. What we observed is in fact the opposite. A company’s data maturity curve often lags its growth curve. A business’s data strategy in the different stages of the DDMM are always behind the current state of growth, because data-related pains don’t appear suddenly. Contrasting any other pain that physically prevents you from doing business e.g., supply chain failures, POS failures, internet outages, etc., data pains are elusive, pernicious, chronic pains that proliferate.
It’s a lot like lower back pain, something many of us just learn to live with. It’s there. It hurts. But we get on with our day. Startups in the Data Aware stage barely feel it. But if left untreated, that pain can show up in the worst and most unexpected ways, and you will pay good money to make it disappear. It’s these sorts of precipitating events that motivate stepwise improvements in a company’s data maturity.
The above graphs are meant to illustrate a specific point: The maturity of a company’s data strategy lags company growth. So, you’re almost always behind the curve when it comes to your data strategy. But the keen reader will realize that, although we have graphed pain (and maturity) over time, they are not causally linked to time. They’re linked to growth. This is the key distinction here. The pains themselves are tied to growth, not time, technology, or the data itself. Untreated pains compound not over time but over growth. Likewise, new pains occur due to growth, not the passage of time.
You may even call them Data Growing Pains.
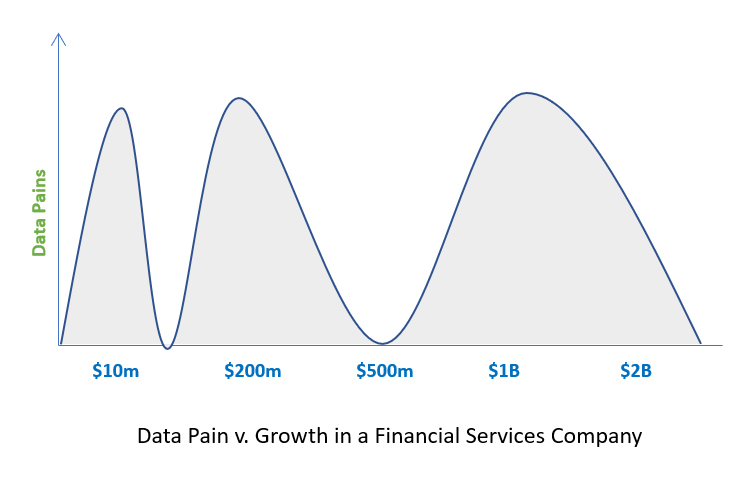
Based on what we have seen across industries, data-related pains tend to become unbearable at certain levels of growth. In the above graph we use revenue as a measurement of growth for a financial services company, but this is also very true of headcount, number of locations, countries in which the company does business, and number of SKUs. Different industries will have different milestones in terms of revenue or headcount at which data pains become unbearable, but the general shape of the Pain vs. Growth curve will be the same. The pain will drop soon after a company undergoes a transition to move from one phase of maturity to the next.
What would happen if you never were to invest in your data strategy? Some in the C-suite believe or experience the first step of data integration as a painful showstopper, leaving them caught at a nascent level of data maturity, despite their rapid growth. This is a quagmire, because not only will you derive all the new problems associated with growth, but the original problems that went unresolved just got worse.
Fortunately, most executives realize the need for Business Intelligence and KPIs. Unfortunately, due to gaps in existing technology/process, industry hype around Big Data and AI, or poor guidance from “experts”, most companies never cross the gap between Data Proficient, having a BI system, and Data Savvy, data-driven decision support and enablement. In fact, many companies now try to bounce the Data Savvy stage entirely and go straight to Data Driven using data science and all the shiny new objects in analytics.
As a result, most industries’ Pain v. Growth curve essentially looks like this:
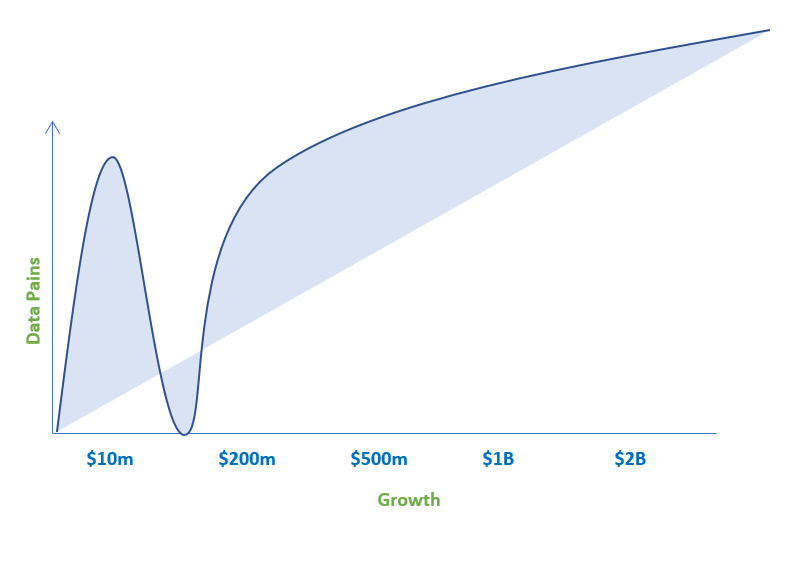
While the pain will continue to worsen with growth, it doesn’t get exponentially worse. Most companies think that the solution is to invest in AI and Big Data, and while they certainly have the data quantity to enable it, the foundations is not in place to act adroitly on the insights that come from Big Data or ML and AI.
It’s also significant to realize that if a company never expands beyond a certain level of growth, it’ll never feel the new pains that accompany that new growth. If the business never adds countries, stores, warehouses, customer types and so on, they’ll never need to transition to a higher stage of data maturity. This is significant for any in the C-suite who believes she can simply deal with it later and focus on other priorities. You cannot delay your data pains unless you also plan on delaying your company’s growth.
How your approach to data can be a competitive advantage, or not
You may be thinking, “OK, company growth causes data pains which, when solved, result in step-wise maturity in our data strategy. But who cares, we’re still growing despite that.” Maybe you’ll continue to grow. The question you ought to be asking is, how much revenue are we leaving on the table by not solving the right problems? Another question to ask is, how long before these inefficiencies start to catch up with us?…and will it cause a premature slow-down in growth? The best question to ask is how bad is this problem for our bigger competitors?
Dashboarding and business intelligence have become commonplace and easily accessible for most companies. This is a good thing, and particularly valuable to small businesses. Tech giants are filing patents on hardware and software that make it faster and more cost-effective to crush big data and incorporate AI. This is useful to the largest and more mature enterprises, but what about everyone else? You’ll notice most relate the pain described here to the process of using data to make decisions. Collection, cleaning, and integration play a very big role in the early phases of growth, but process, people and line of business integration play an equally big role in later phases.
While the marketplace is focusing on the flashy things like AI and big data, the truth is most industries will have problems with the process of making data-driven decisions with the data they currently have long before they are ready for AI and big data. As mentioned earlier, many large enterprises never truly make the leap between Data Proficient to Data Savvy, with C-Suites choosing instead to leverage the most recent data vendor IPO or bleeding-edge innovation.
An enormous opportunity for a Scale-Up Mindset
Most think about applying innovative technology to gain a competitive edge. Less people think about process or operational frameworks (e.g. DevOps) and how to uniquely apply them to your business. While I’m not saying you need to run out and file a patent on how you make data decisions, what I am suggesting is that if you can execute processes that allow you to be nimble with your data early in your growth curve, then you have a huge advantage over larger companies that didn’t.
This Scaleup Mindset’s major competitive advantage is having the ability to jump into a meeting room, pull up some numbers and make decisions. If a company can retain that agility throughout its growth, it can continue to run circles around its larger rivals. The net effect is bridging the gap between the Growth Curve and the Data Maturity Curve and, consequently, the data pains associated with growth.
For more information on our data and analytics consulting services contact us at Info@ctidata.com.